Features
Discover how the MiningBull platform can make finding your next investment a breeze by using our unique features designed to give you an edge.
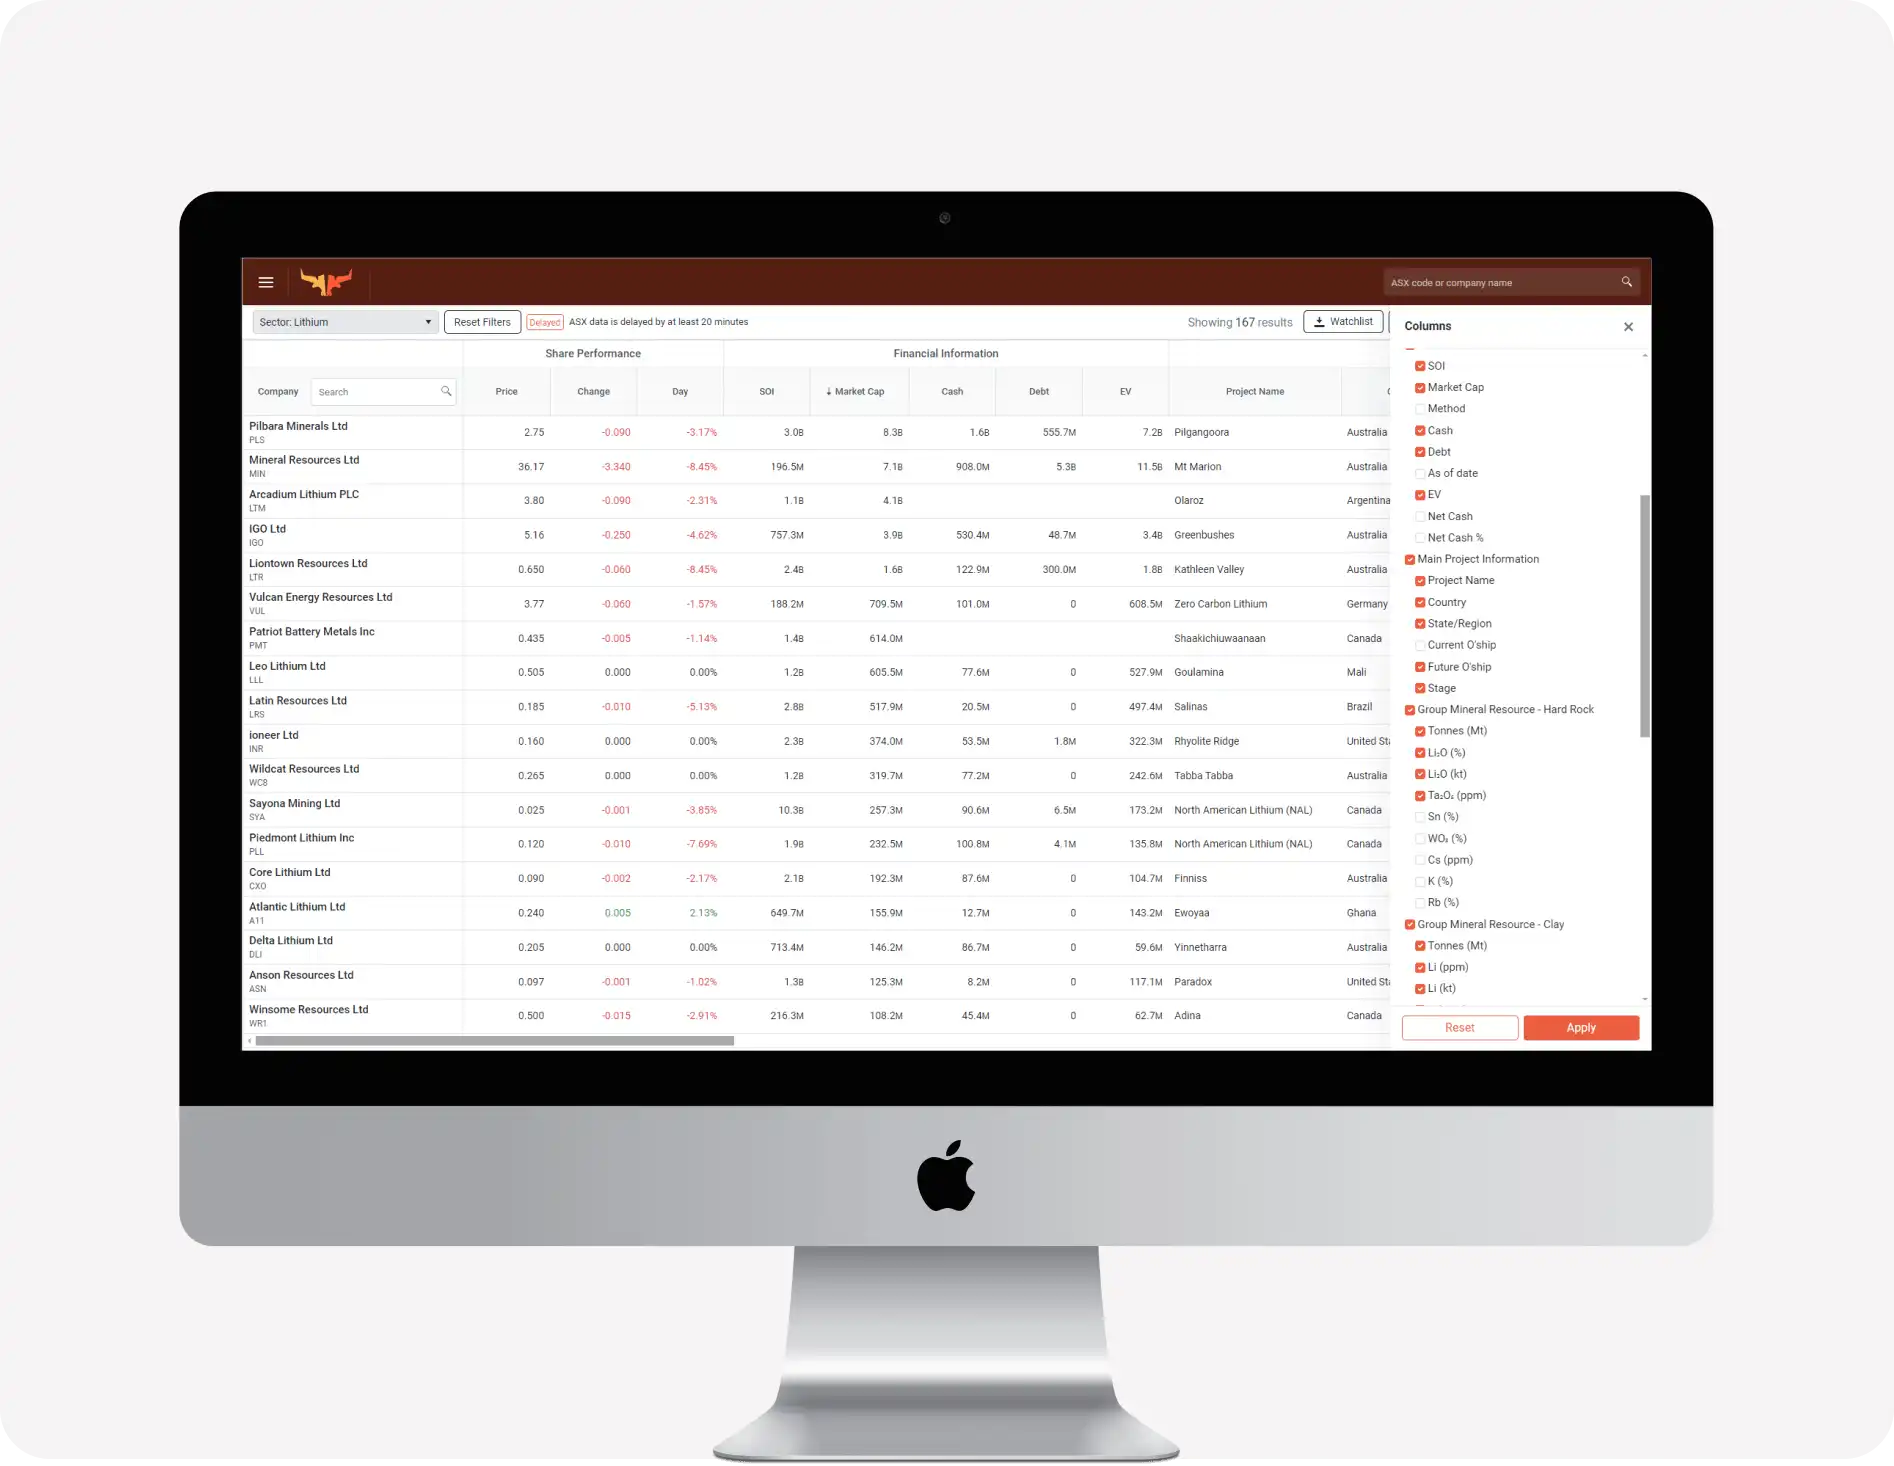
Company & Project Database
Company View
Sort and filter a list of companies by your choice of trading data, financial data, or fundamental information. See stock prices & performance, trading volumes, and market capitalisations with 20-minute delayed data from the ASX.
- See a list of gold companies that have their main project located in Western Australia and a minimum of 500 koz of combined group resources
- Find companies below $5M in market capitalisation that reported at least $2M in cash in their most recent Quarterly Report
- Generate a list of companies with a niobium project located in Brazil or a gold project currently in production in Western Australia
- Display the top-performing stocks in the Uranium sector for the day
- Show the mining companies with a minimum turnover of $50k for the current trading day that have at least 2X the average trading volume
- Display a list of Gold companies sorted by contained gold reserve ounces per million dollars of market capitalisation
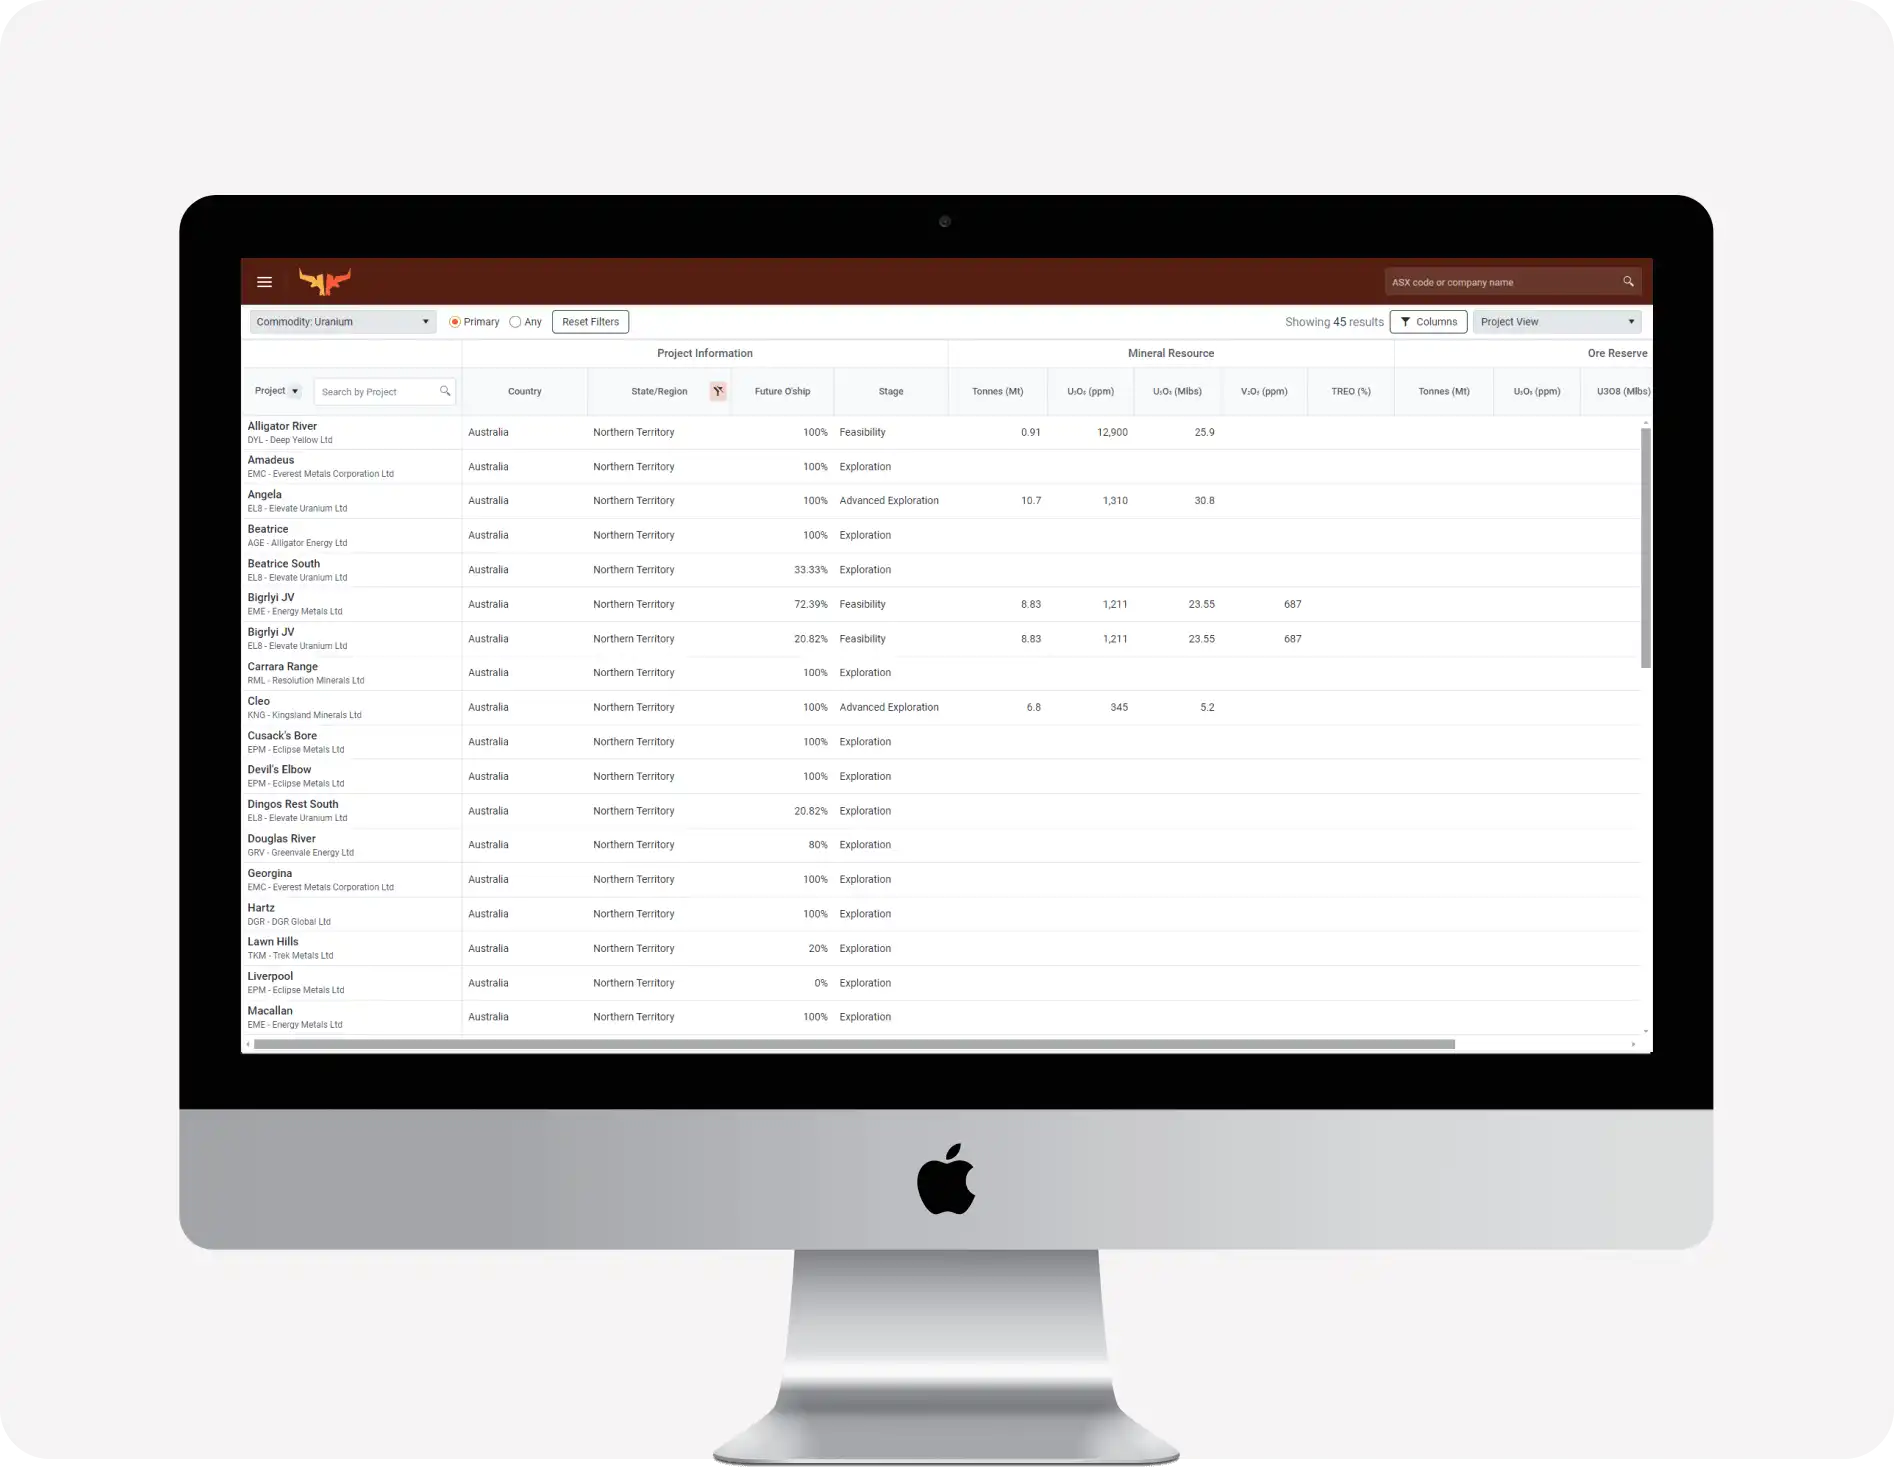
Project View
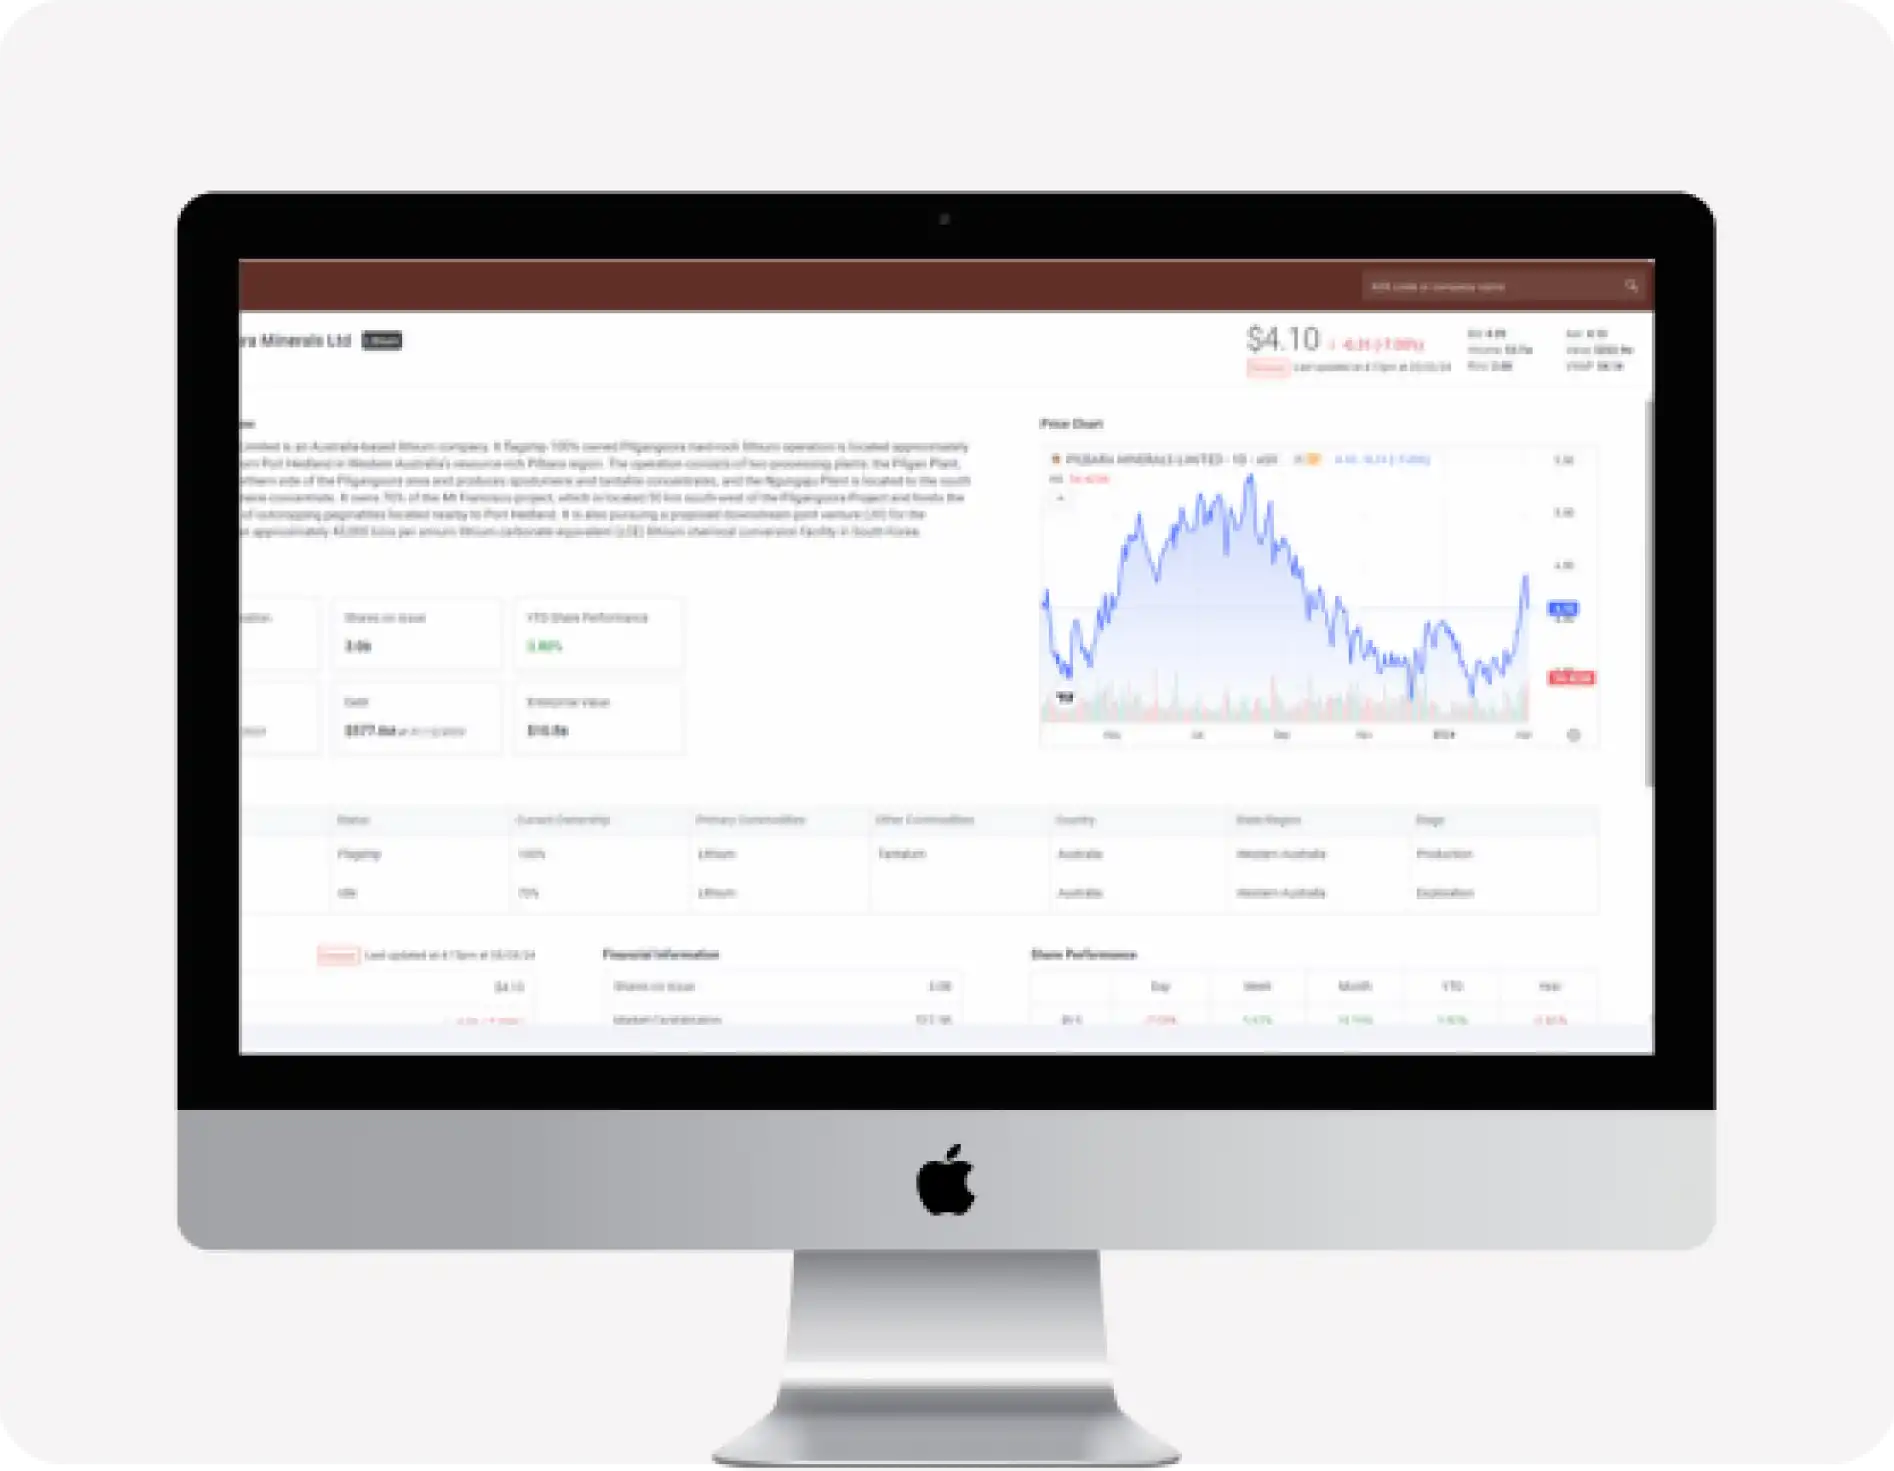
Project View allows you to sort and filter projects by commodity, location, stage, feasibility study metrics or JORC mineral resources and ore reserves.
- Display a list of projects in South Australia that are targeting Copper as the Primary Commodity
- Filter a list of uranium projects in the Northern Territory with a minimum of 10Mlbs of contained U308 resources.
- Display a list of gold projects with a published feasibility study and compare metrics like average gold production, initial capex, NPV and IRR.
- Find the highest-grade copper project in Australia with a minimum of 100t of contained copper resources.
- Display a list of all the projects in Canada that are targeting Rare Earth Elements
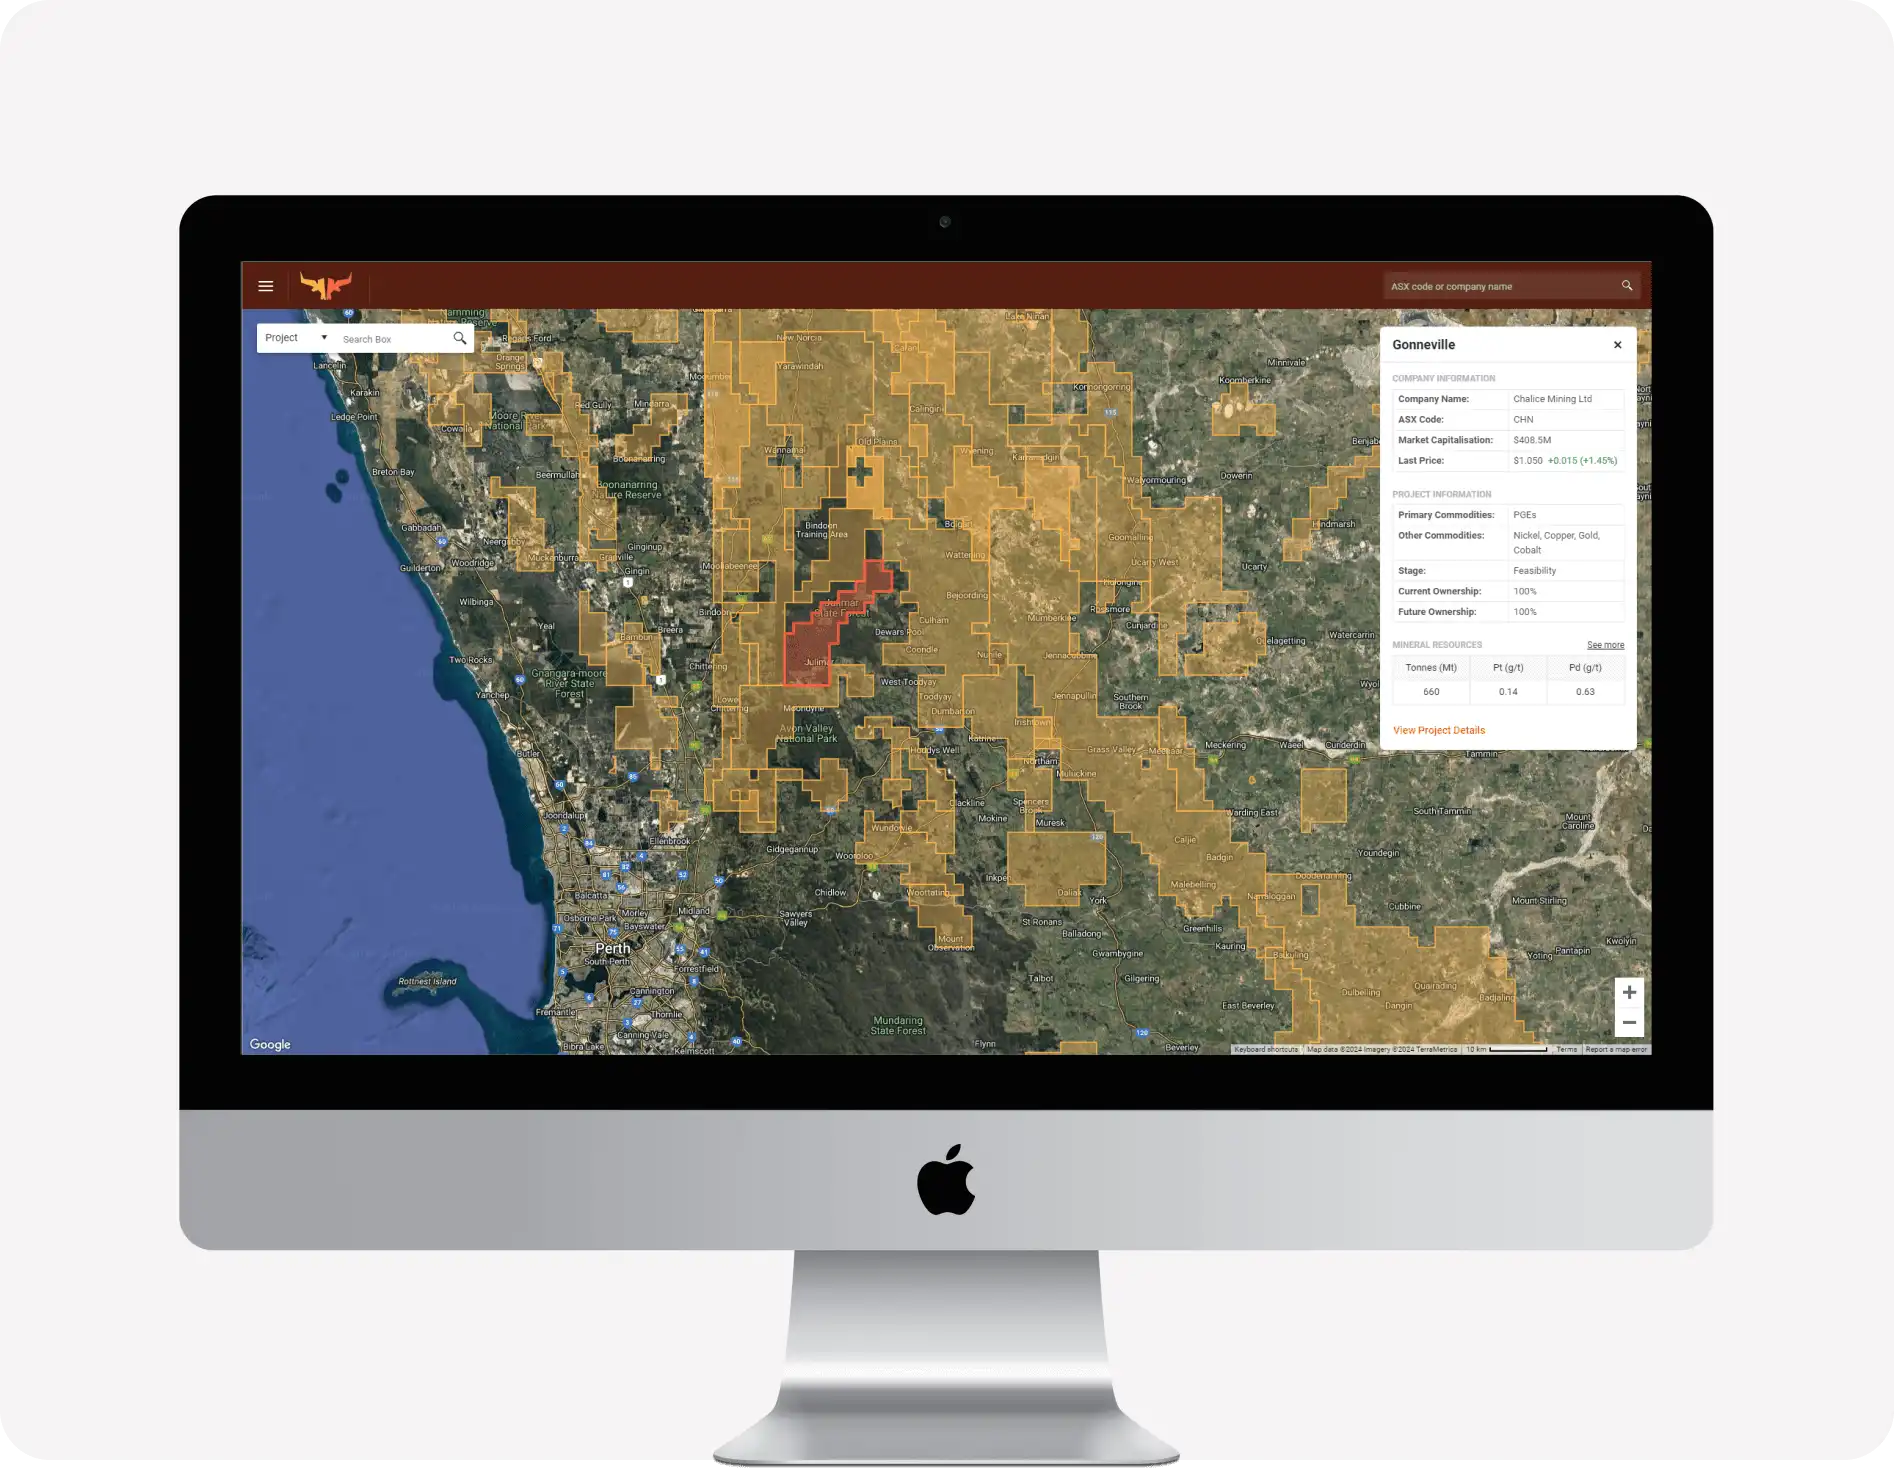
Interactive Maps
As the old real estate saying goes ...
"Location, location, location!"
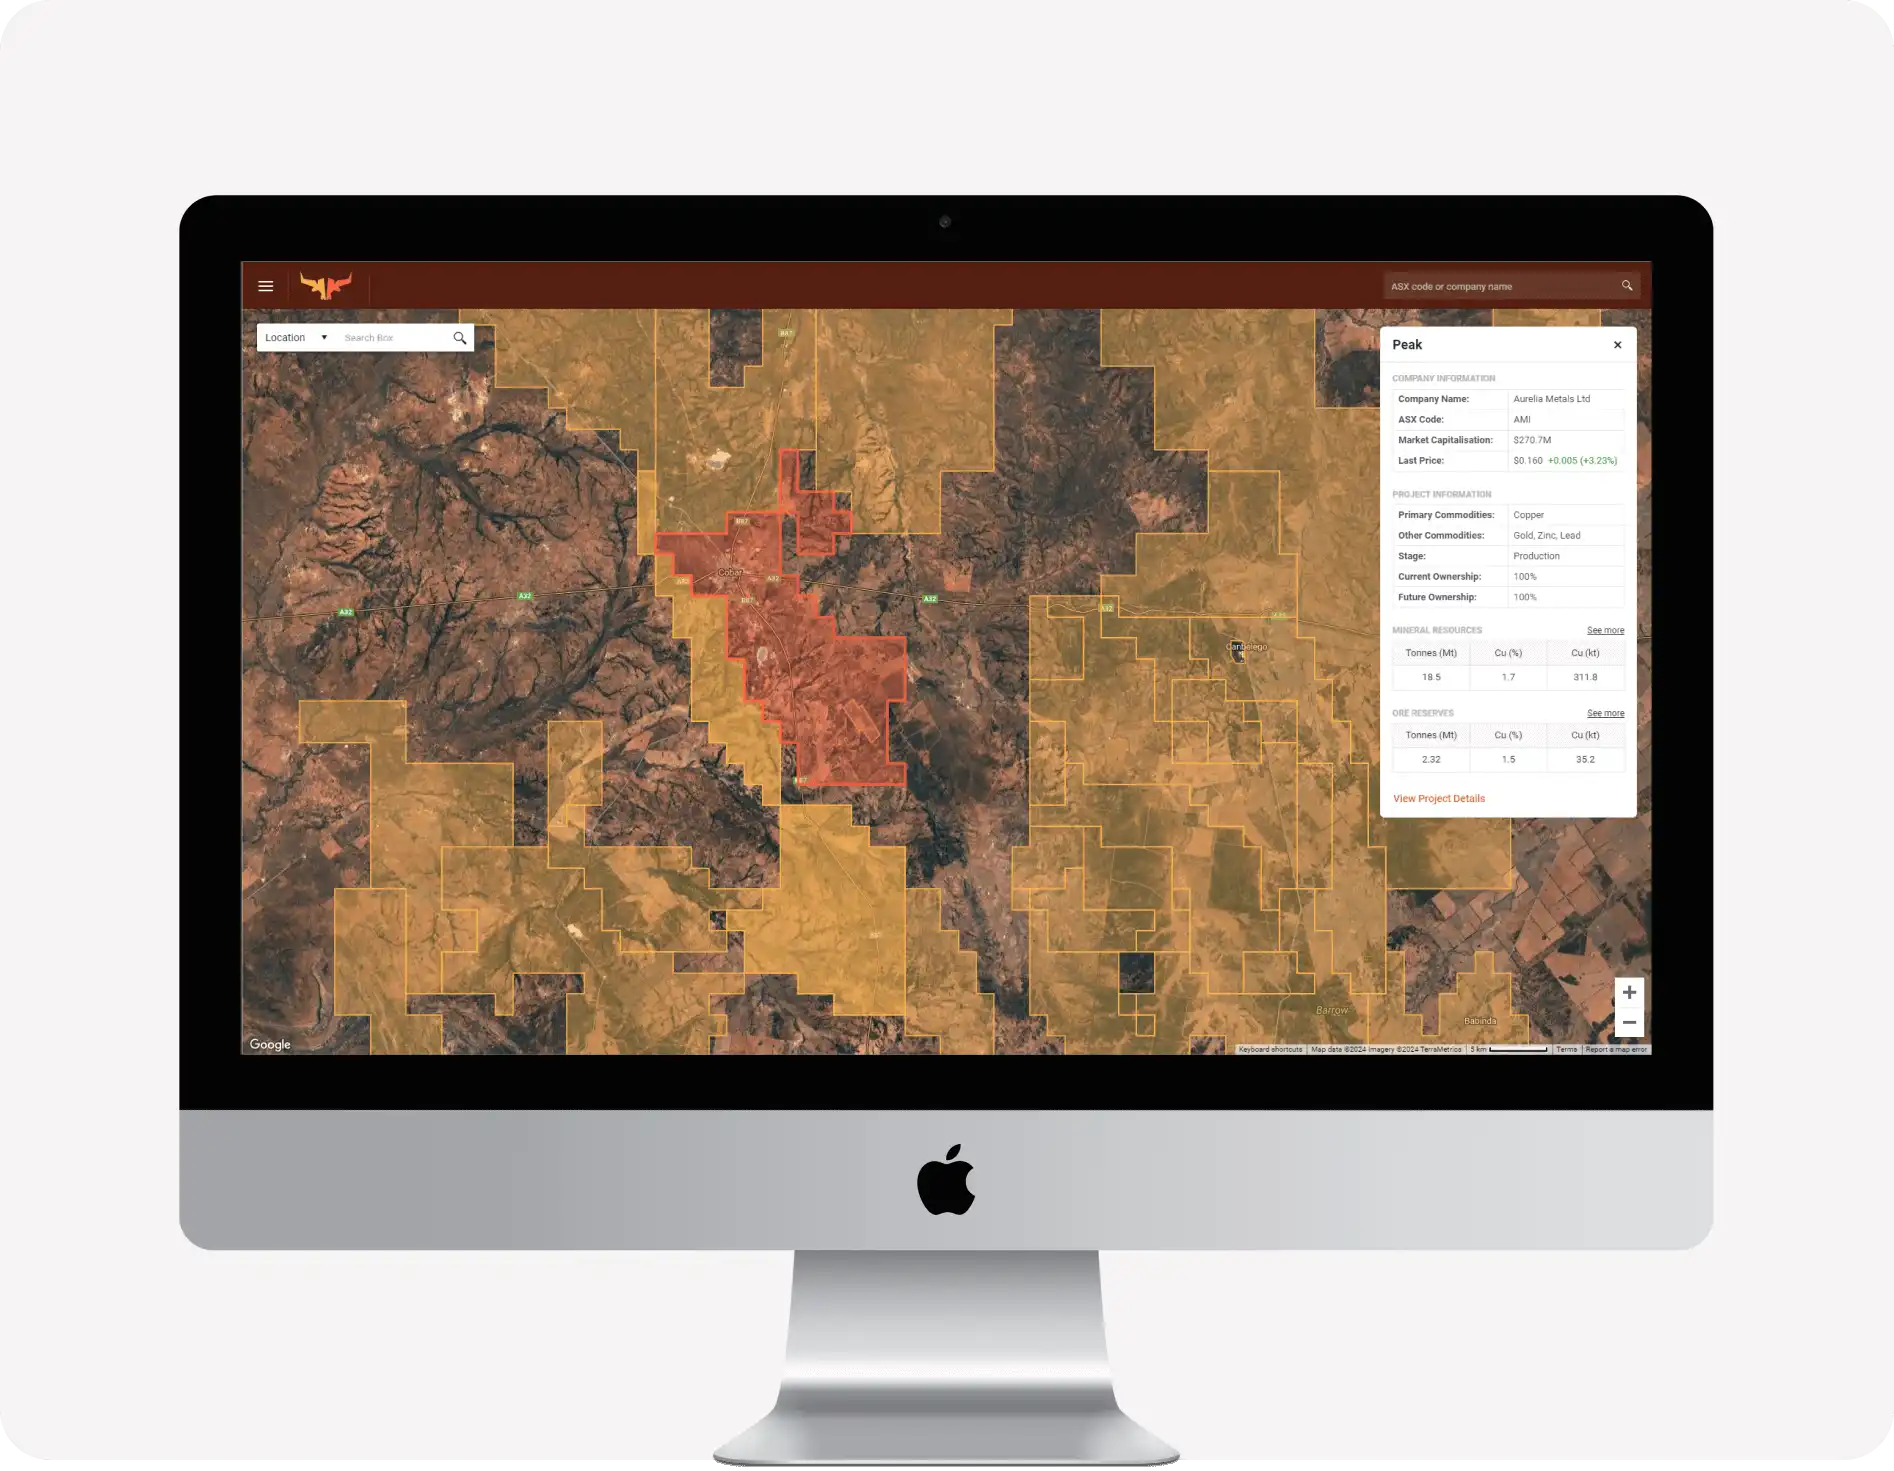
Use our brand-new interactive mapping interactive-map to see the location and tenement boundaries of more than 3000 Australian projects on the crystal-clear Google Maps API.

- Find companies with large tenement holdings in the best areas in seconds
- Check the location of projects in relation to existing mines or other infrastructure
- Identify the companies with projects near the latest big discovery (i.e., nearology plays)
- See the location of recently acquired projects and tenements
Search the map by project or location, or simply click a tenement boundary to see key information, including company ownership, target commodities, stage, mineral resources, and ore reserves.
Advanced Tools
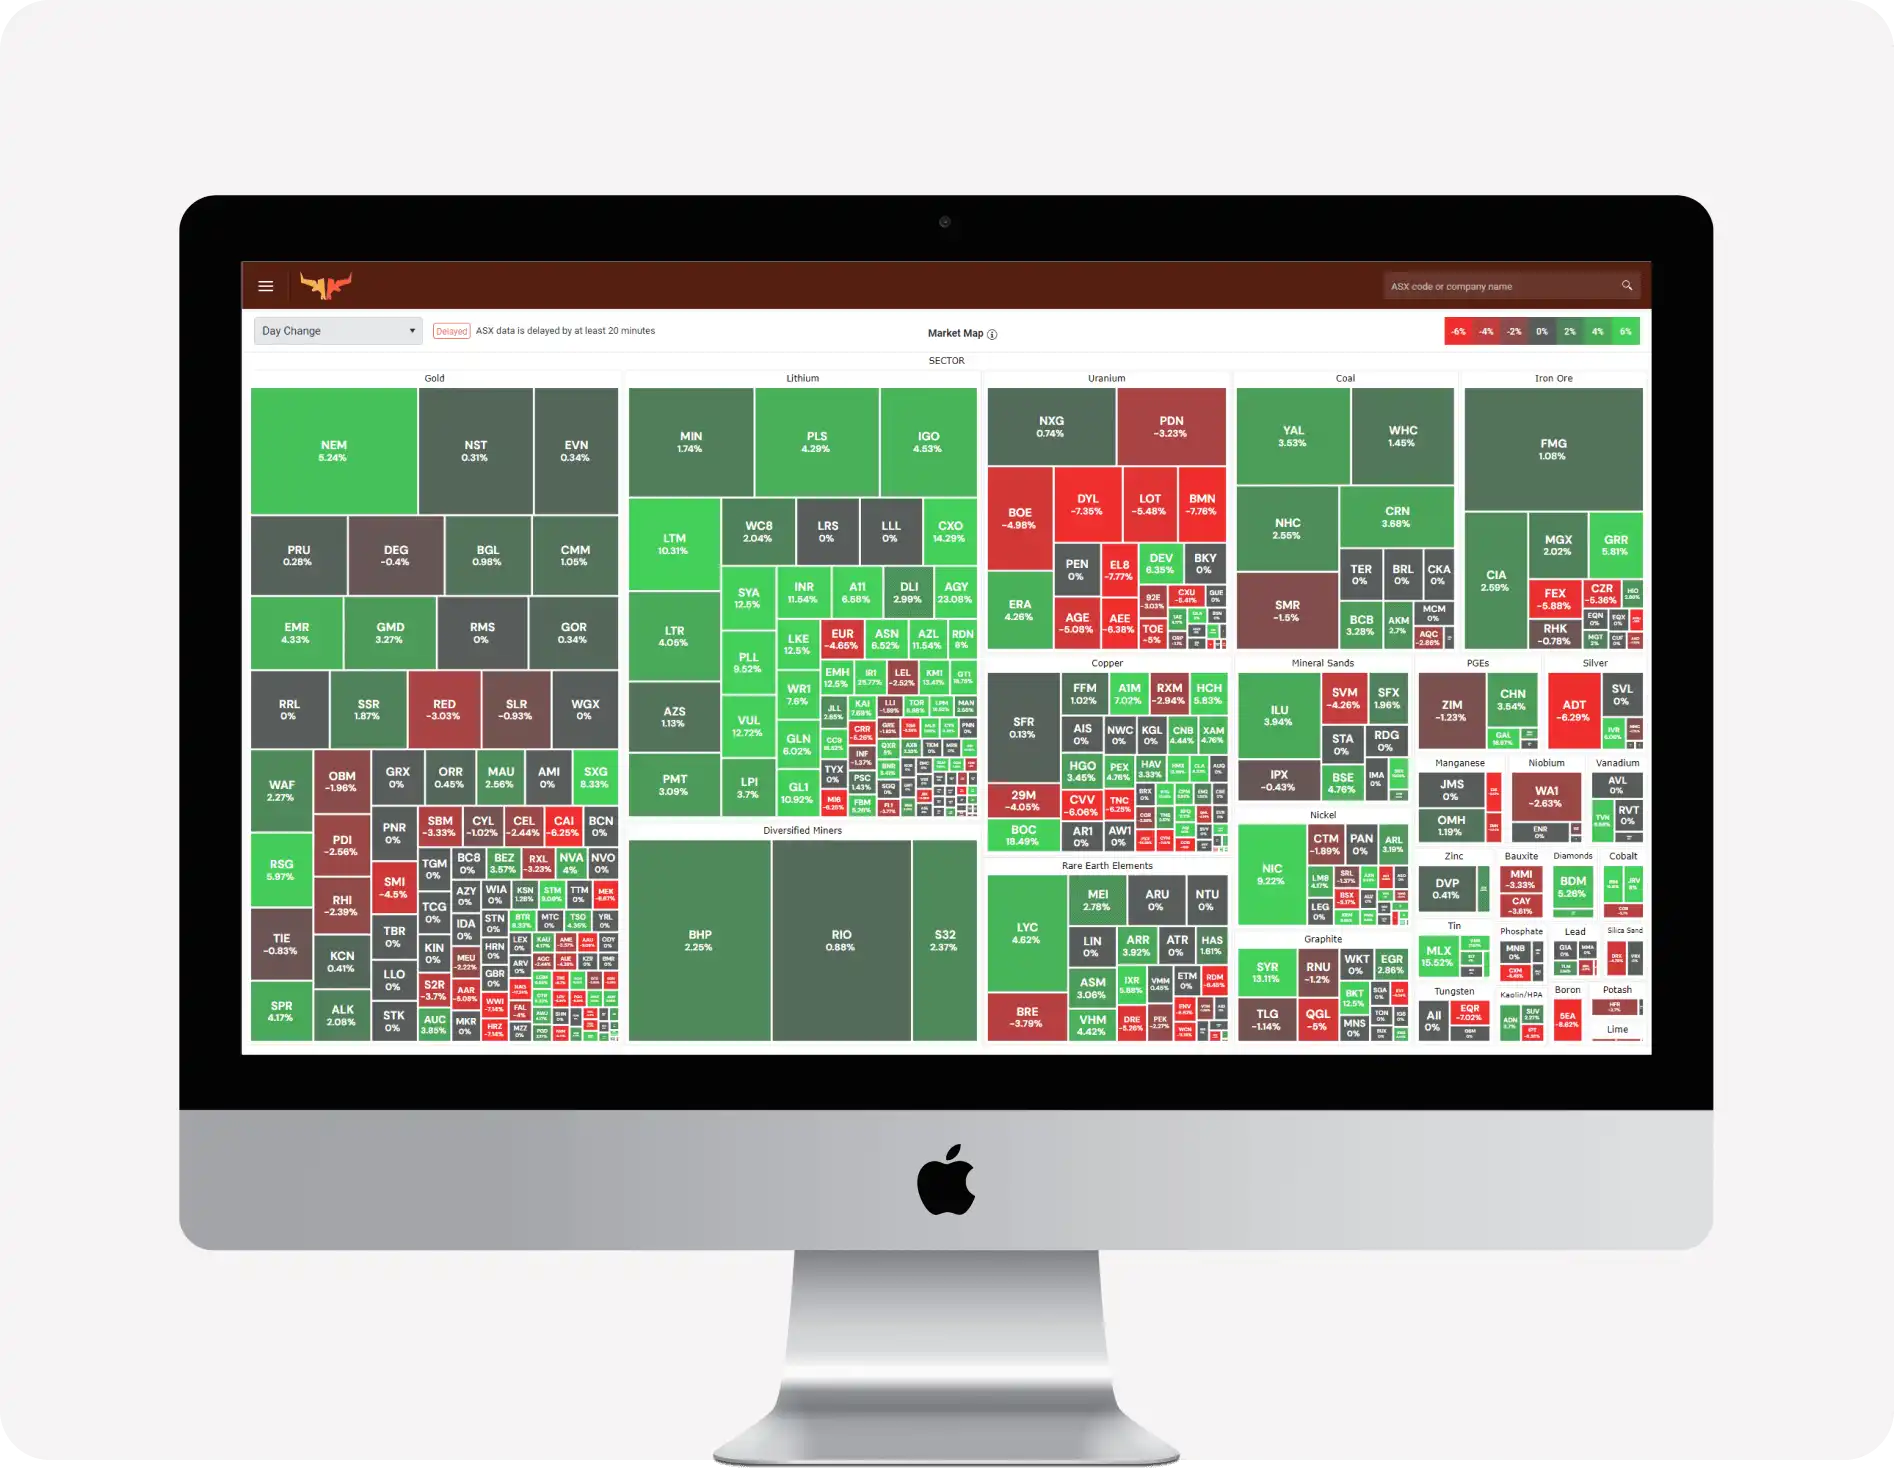
Share Price Market Maps
Instantly see what's happening in the market using our powerful Market Map tool and identify the top performing companies or sector trends over a day, week, month, YTD or one year timeframe. Drill into the action by holding your cursor over the stock to see trading data, or click to visit the dedicated company page.
Relative Volume Market Maps
Gain insights into the companies or sectors that have unusual trading volumes using our Relative Volume heatmap. Now you can instantly see where all the action is to ensure that you never miss out on finding the right trade in the most active stock.
Join today and take your mining portfolio to the next level.
Join Now30-day full refund. Try it risk free.

